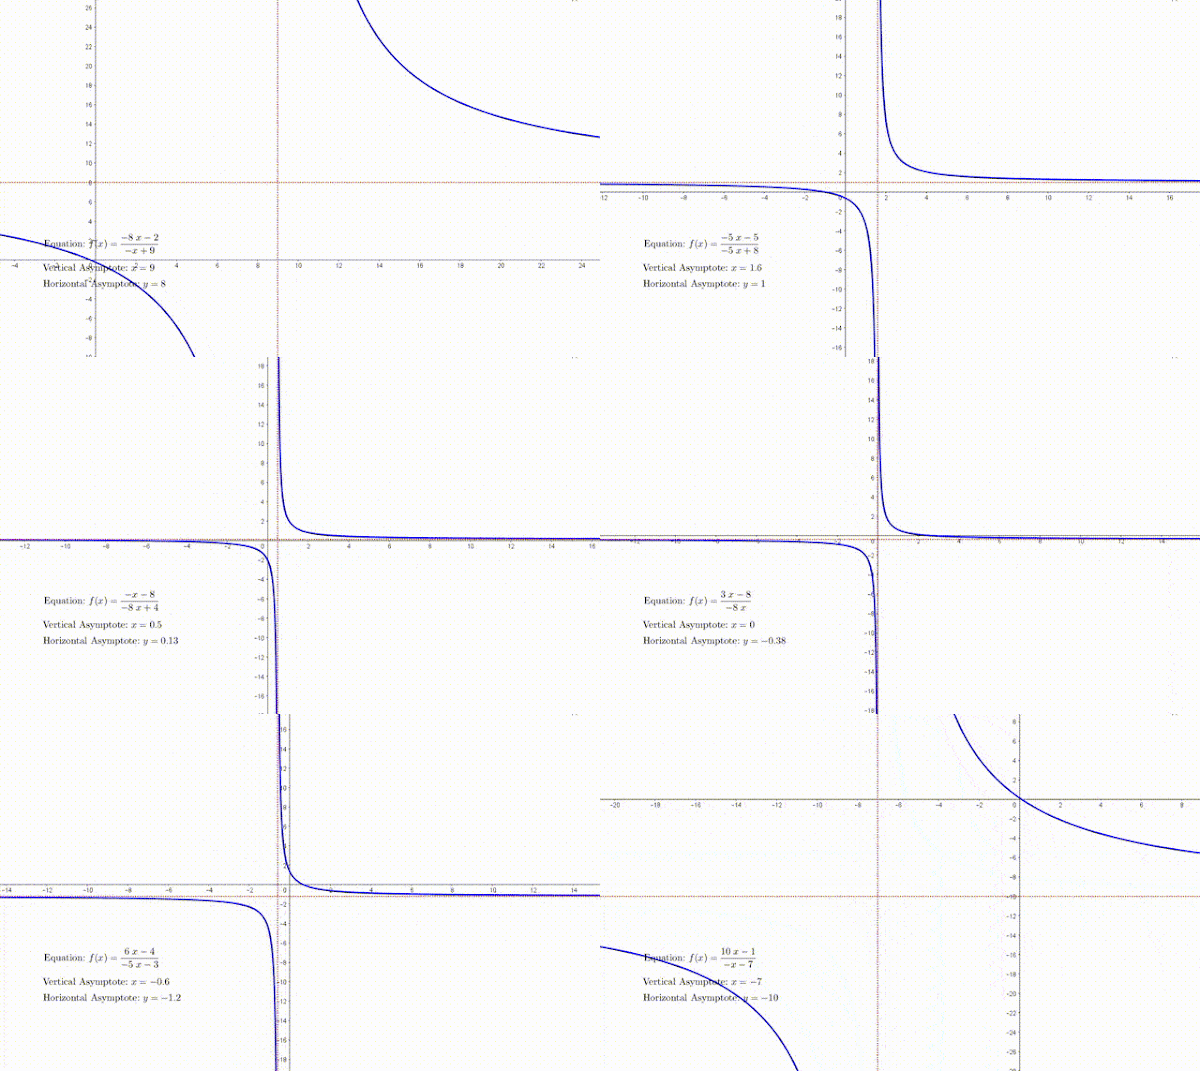
Rational Functions
ပိုင်းဝေနှင့် ပိုင်းခြေ နှစ်ခုလုံး polynomial ဖြစ်နေသော အပိုင်းကိန်း ပုံစံကို rational function ဟုခေါ်သည်။ ဒဿမတန်း (သင်ရိုးသစ်) တွင် အခြေခံဖြစ်သည့် linear polynomial နှစ်ခု၏ အချိုးဖြင့်သာ ဖေါ်ပြသော rational function ပုံစံကိုသာ သင်ယူရမည် ဖြစ်သည်။
| General Form | Asymptote Form |
|---|---|
| $ y=\displaystyle\frac{{ax+b}}{{cx+d}},\ x\ne -\displaystyle\frac{d}{c}$ | $y=\displaystyle\frac{k}{{x-p}}+q,\ k\ne 0\ \text{and}\ x\ne p$ |
လက်တွေ့ graph ရေးဆွဲရာတွင် Asymptote Form က graph nature ကို လွယ်ကူစွာ ခန့်မှန်းနိုင်သည်။ ထို့ကြောင့် rational function တစ်ခုကို general form ဖြင့်ပေးထားလျှင် asymptote form သို့ ပြောင်းခြင်း အားဖြင့် graph ကို လွယ်ကူစွာ ရေးဆွဲနိုင်သည်။ asymptote form ၏ constant တစ်ခု ဖြစ်သော $k$ ၏ လက္ခဏာပေါ် မူတည်၍ rational function တစ်ခု ပုံစံကို အောက်ပါအတိုင်း ခွဲခြားနိုင်သည်။
General form $\displaystyle \frac{{ax+b}}{{cx+d}}$ မှ asymptote form $\displaystyle \frac{k}{{x-p}}+q$ သို့ အောက်ပါအတိုင်း ပြောင်းယူနိုင်ပါသည်။
$ y=\displaystyle\frac{k}{{x-p}}+q$ ပုံစံတွင် $x$ ၏ ပမာန အလွန်ကြီးလာသည့် အခါ $y=\displaystyle\frac{k}{{x-p}}$ ပမာဏ အလွန်သေးငယ်သွားပြီး $0$ သို့ ချဉ်းကပ်သွားမည် ဖြစ်သည်။ သို့သော် $k \ne 0$ ဖြစ်သောကြောင့် $y=\displaystyle\frac{k}{{x-p}}$ သည် မည့်သည့်အခါမျှ $0$ နှင့် မညီပါ။ ထိုအခါ y သည်လည်း $q$ သို့ ချဉ်းကပ်သွားမည် ဖြစ်သည်။ ထိုသို့ graph က တဖြည်းဖြည်း ချဉ်းကပ်သွားသော ရေပြင်ညီမျဉ်း $y=q$ ကို horizontal asymptote ဟုခေါ်သည်။
အလားတူပင် $ y=\displaystyle\frac{k}{{x-p}}+q$ ပုံစံတွင် $p = 0$ ဖြစ်လျှင် function ကို define မလုပ်နိုင်သောကြောင့် $p ≠ 0$ ဖြစ်ရပါမည်။ သို့သော် $x$ သည် $p$ သို့ ချဉ်းကပ်သွားသည့်အခါ $ y=\displaystyle\frac{k}{{x-p}}+q$ သည် ပမာဏ ကြီးမားလာပြီး မည်၍မည်မျှရှိမည်ကို မသတ်မှတ်နိုင်သောကြောင့် အနန္တပမာဏ (infinity) ဟုသတ်မှတ်သည်။
- $x$ သည် $p$ နှင့် အလွန်နီးကပ်လာပြီး $p$ အောက် အနည်းငယ် ငယ်လျှင် $x \rightarrow p^{-}$ ဟုသတ်မှတ်သည်။ $p$ ၏ လက်ဝဲဘက်မှ ချဉ်းကပ်သည်ဟု ခေါ်သည်။
- $x$ သည် $p$ နှင့် အလွန်နီးကပ်လာပြီး $p$ ထက် အနည်းငယ် ကြီးလျှင် $x \rightarrow p^{+}$ ဟုသတ်မှတ်သည်။$p$ ၏ လက်ယာဘက်မှ ချဉ်းကပ်သည်ဟု ခေါ်သည်။
- $x \rightarrow p^{-}, k>0$, $y \rightarrow -\infty$
- $x \rightarrow p^{-}, k<0$, $y \rightarrow \infty$
- $x \rightarrow p^{+}, k>0$, $y \rightarrow \infty$
- $x \rightarrow p^{+}, k<0$, $y \rightarrow -\infty$
ထို့ကြောင့် graph က တဖြည်းဖြည်း ချဉ်းကပ်သွားသော ထောင်လိုက်မျဉ်း $x=p$ ကို vertical asymptote ဟုခေါ်သည်။
Graph ဆွဲရန်အတွက် $x$-intercept (when $y=0$) နှင့် $y$-intercept (when $x=0$) တို့ကို ရှာပေးရမည်။ ပေးထားသော function ပေါ်မူတည်၍ $x$-intercept နှင့် $y$-intercept မရှိသော အခြေအနေများလည်း တွေ့ရနိုင်ပါသည်။
Function တစ်ခု၏ domain ဆိုသည်မှာ အဆိုပါ function ကို define ဖြစ်စေသော x တန်းဖိုးများ အားလုံးပါဝင်သော အစုဖြစ်သည်။ $ y=\displaystyle\frac{k}{{x-p}}+q$ တွင် $x$ သည် $p$ ဖြင့် ညီခွင့် မရှိသောကြောင့် Domain = $\left\{ {x\ |\ x\ne p,x\in R} \right\}$ ဟု ပုံသေမှတ်ယူနိုင်သည်။ အလားတူပင် Function တစ်ခု၏ range ဆိုသည်မှာ image ($y$) များပါဝင်သော အစုဖြစ်သည်။ $y$ သည် $q$ ဖြင့် မည်သည့်အခါမျှ မညီနိုင်သောကြောင့် Range = $\left\{ {y\ |\ y\ne q,y\in R} \right\}$ ဟု ပုံသေမှတ်ယူနိုင်သည်။ ယခုရှင်းလင်းချက် အကြောင်းအရာတို့ကို ကောင်းစွာနားလည်ပြီးလျှင် exercise (4.5) ကို ဖြေရှင်းနိုင်ပြီ ဖြစ်သည်။
Exercise (4.5)
- Sketch the graphs of the following functions.
(a) $y=\displaystyle\frac{1}{x}$
[Show Solution ]
(b) $y=\displaystyle\frac{3}{x}$
[Show Solution ]
(c) $y=-\displaystyle\frac{2}{x}$
[Show Solution ]
(d) $y=-\displaystyle\frac{1}{2 x}$
[Show Solution ]
(e) $y=\displaystyle\frac{1}{3 x}$
[Show Solution ]
State the domain and range of each function. - Sketch the graphs of:
(a) $y=-\displaystyle\frac{2}{x}+1$
[Show Solution ]
(b) $y=\displaystyle\frac{2}{x-3}$
[Show Solution ]
(c) $y=-\displaystyle\frac{1}{x+1}-1$
[Show Solution ]
(d) $y=\displaystyle\frac{2}{x+1}+2$
[Show Solution ]
State the domain and range of each function. - Sketch the graphs of:
(a) $y=\displaystyle\frac{x+1}{x-1}$
[Show Solution ]
(b) $y=\displaystyle\frac{-3 x+4}{x-2}$
[Show Solution ]
(c) $y=\displaystyle\frac{2 x-3}{3 x+1}$
[Show Solution ]
State the domain and range of each function.


0 Reviews:
Post a Comment